Bioavailability and Area under the Curve (AUC)
Bioavailability is a key pharmacokinetic parameter representing the extent and rate at which an active drug ingredient or therapeutic moiety enters systemic circulation, thereby reaching the site of action. In simple terms, it indicates the percentage of the administered drug that effectively reaches the bloodstream in an unchanged form.
Graph of Bioavailability: Plasma Concentration vs. Time
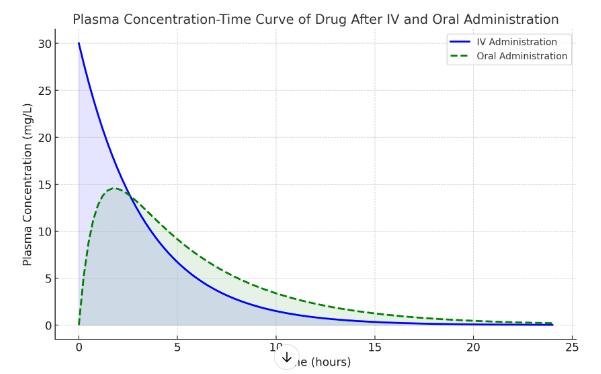
To illustrate bioavailability, let's examine a typical Plasma Concentration-Time Curve for a drug administered orally and compare it to intravenous (IV) administration.
Steps:
- Oral vs. IV Administration: Drugs administered orally must pass through the digestive system and liver (first-pass metabolism), reducing the fraction that reaches systemic circulation. In contrast, IV administration directly introduces the drug into the bloodstream, providing 100% bioavailability.
- AUC (Area under the Curve): AUC is a crucial measure to represent total drug exposure over time and indicates the drug's bioavailability. A higher AUC value correlates with higher bioavailability.
Explanation of the Bioavailability Graph
This Plasma Concentration-Time Curve compares the drug concentration in the blood after IV administration and oral administration:
- IV Administration (blue line): The drug enters the bloodstream immediately, achieving peak concentration at time zero. As the drug is metabolized and eliminated, the concentration decreases over time. The area under the curve (AUC) for IV administration is larger, as 100% of the drug reaches the bloodstream directly.
- Oral Administration (green dashed line): The drug concentration rises more slowly, reaching a lower peak as it is absorbed through the gastrointestinal tract and undergoes first-pass metabolism in the liver. As a result, the AUC for oral administration is smaller, indicating a lower bioavailability.
Area under the Curve (AUC) and Its Importance
AUC represents the total drug exposure over time. It is directly related to the bioavailability of the drug. A higher AUC means more drug has entered systemic circulation, while a lower AUC indicates less drug has been absorbed due to metabolism or incomplete absorption.
Bioavailability Calculation: By comparing the AUC of oral (or any non-IV) administration to IV administration (which is 100% bioavailable), we can quantify the bioavailability as a percentage. For instance, if the AUC of oral administration is 50% of the IV AUC, the drug's bioavailability is 50%.
Clinical Relevance
- Determining dosing requirements: Drugs with low bioavailability may need higher or more frequent doses.
- Adjusting routes of administration: If a drug's oral bioavailability is too low, alternative administration routes (e.g., IV) might be preferred to achieve therapeutic effects.
- Monitoring drug levels: AUC helps predict efficacy and toxicity, as total exposure affects therapeutic outcomes.
