"
Dose-Response Curve
The dose-response curve represents the relationship between the dose of a drug and the magnitude of its effect on the body. This curve helps to understand the drug’s potency, efficacy, and safety and is fundamental in pharmacology for evaluating how a drug interacts with its target at varying concentrations.
Types of Dose-Response Curves
- Graded Dose-Response Curve:
- This curve shows a continuous range of responses as the dose increases, often observed with a single subject or tissue.
- Example: The response of blood pressure to increasing doses of a vasodilator.
- Importance: It helps determine the EC50 (the concentration at which the drug produces 50% of its maximal effect), indicating the potency of the drug. It also shows the Emax (the maximum effect), which reflects the drug’s efficacy.
- Quantal Dose-Response Curve:
- This curve is used to show the "all-or-none" response, typically in a population. It represents the percentage of individuals responding to a specific dose.
- Example: The response of a population to an analgesic, measured as the percentage of people who experience pain relief at various doses.
- Importance: It helps calculate the ED50 (effective dose for 50% of the population) and LD50 (lethal dose for 50% of the population in toxicity studies). These values aid in determining therapeutic windows and the safety of the drug.
Explanation of the Dose-Response Curves
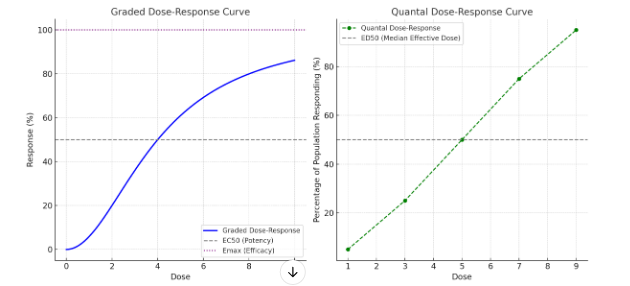
- Graded Dose-Response Curve (left):
- The curve demonstrates a sigmoidal shape (S-curve), where the response increases with the dose up to a maximum effect.
- EC50 (indicated by the dashed line at 50%) shows the concentration where 50% of the maximum response (Emax) is achieved, giving insight into the potency of the drug.
- Emax (the maximum effect at 100%) shows the drug’s efficacy, indicating the highest response achievable regardless of dose increase.
- Quantal Dose-Response Curve (right):
- This graph represents an all-or-none response in a population.
- ED50 (the dose at which 50% of the population shows the desired effect) provides information on the median effective dose, which is crucial for determining appropriate dosing in a population.
- It also aids in estimating therapeutic index by comparing with toxic or lethal doses (e.g., LD50).
Importance of Dose-Response Curves
- Guides Dosing: Helps in setting safe and effective dose ranges for drugs.
- Evaluates Drug Potency and Efficacy: Useful in comparing drugs and choosing the most potent option with the highest therapeutic effect.
- Therapeutic Index: Quantal curves especially help calculate the therapeutic window, aiding in assessing a drug's safety margin.
These curves form the foundation for understanding drug action, optimizing therapeutic doses, and reducing potential risks in drug administration.
Graph of Dose-Response Curve
